Weekly Trader's Outlook
Bulls Find Their Footing Amid Hawkish Fed Surprise

The Week That Was
If you read last week's blog, you might recall that I had a "Bullish" forecast for this week, citing the new all-time highs in both the S&P 500 Equal Weight (SPXEW) and Russell 2000 (RUT) and the passing of the SpaceX IPO, the lead up to which may have been generating selling pressure in the tech space. Stocks are on track to be higher and three of the major indices hit fresh record highs this week, but it was not without a bout of volatility. Markets were caught off-guard at yesterday's FOMC meeting which delivered a hawkish surprise from the Federal Reserve. Incoming Fed Chair Kevin Warsh sent a firm message that the committee is focused on price stability given the stability in the labor market. Stocks sank and 2-year yields spiked as investors re-calibrated expectations around the trajectory of the Fed funds rate (more on this in the "Economic Data, Rates & the Fed" section below).
Regarding U.S.- Iran relations, the two countries have signed a memorandum of understanding that initiates a 60-day period of negotiations, with technical talks to begin this weekend. Vice President JD Vance said that the U.S. has started to ease military restrictions on shipping and stated that more than 12.5M barrels of oil have passed through the Strait of Hormuz last night. However, Israel has continued strikes on Lebanon and questions remain over the future of Iran's nuclear program, so there are still issues that need to be addressed during the negotiation period. Regardless, oil prices have responded positively to the progress as WTI crude is down 9.5% to roughly $75/barrel this week, the lowest levels since early March.
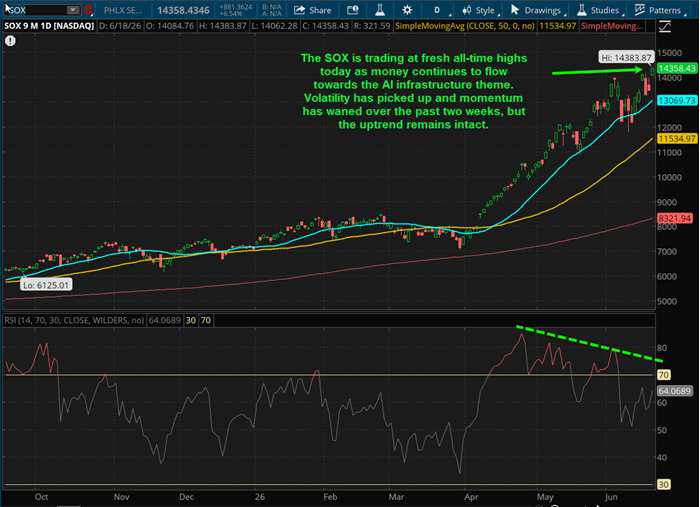
In my view, the bull market is primarily being supported by two driving forces, and they are related: a) 20% corporate earnings growth for the coming quarters and b) the AI infrastructure buildout theme remains in its expansionary phase and demand for compute still outstrips available supply. For evidence, look no further than the PHLX Semiconductor Index (SOX) which is hitting fresh all-time highs today. It seems that the AI theme will continue to dominate trader psychology until there is evidence that demand and supply are balanced and/or hyperscaler spending on AI shows sign of fatigue or deceleration (note: Nvidia announced a $25B corporate debt offering early this week, which follows Alphabet's ~$85B capital raise earlier this month).
Outlook for Next Week
At the time of this writing (3:10 PM ET) all the majors are higher across the board, though off the highs of the session (DJI + 77, SPX + 64, $COMP + 380, RUT + 45). Today's "bounce back" from yesterday's FOMC sell-off appears to be supported by lower oil prices and stable Treasury yields. Yes, Warsh delivered a firm message that inflation is the Fed's focus and rate hikes are likely, but the number and cadence of those potential hikes will likely determine how disruptive it is to markets. Next week we'll get the monthly PCE Prices report, though I'm not sure whether the data will matter now that oil prices have moved into a downtrend. The other major catalyst is next Wednesday's quarterly earnings from memory giant Micron Technology, which is hitting fresh all-time highs today. Last quarter Micron delivered blowout results and guidance, yet the post-earnings reaction was bearish, so the question is how high are investor expectations heading into next week's results? For reference, MU was trading at roughly $460 heading into last quarter's results and are trading at $1,145 today, so expectations are obviously elevated, and the potential for higher volatility in the overall chip/AI complex is present next week. The other potential market-moving catalysts are any disruptions in the U.S./Iran MOU and potentially a creep higher in yields (2-year Treasuries hit a 52-week high of 4.21% earlier today but are back to 4.18%). The near-term technicals are bullish, though technicals within the tech space look susceptible to higher volatility relative to SPXEW/RUT. Taking everything into account, I'm providing a "Moderately Bullish" forecast for next week, with the potential for bumpier price action in the technology space. I'm not bearish on tech, but I believe the potential for rotation along with the post-earnings reaction from Micron leaves the door open for some tech volatility.
Other Potential Market-Moving Catalysts
Economic:
- Monday (6/22): no reports
- Tuesday (6/23): no reports
- Wednesday (6/24): Current Account Balance, EIA Crude Oil Inventories, MBA Mortgage Applications Index, New Home Sales
- Thursday (6/25): Continuing Claims, Durable Goods, EIA Natural Gas Inventories, Q2 GDP – Third Estimate, Initial Claims, PCE Prices, Personal Income, Personal Spending
- Friday (6/26): Advanced International Trade in Goods, Advanced Retail Inventories, Advanced Wholesale Inventories, University of Michigan Consumer Sentiment
Earnings:
- Monday (6/22): American Resources Corp. (AREC), Ennis Inc. (EBF), Fervo Energy Co. (FRVO), ICON PLC (ICLR), Outdoor Holding Company (POWW)
- Tuesday (6/23): Carnival Corp. (CCL), Cerebras Systems Inc. (CBRS), FedEx Corp. (FDX), KB Home Inc. (KBH), Korn Ferry (KFY)
- Wednesday (6/24): Daktronics Inc. (DAKT), H.B. Fuller Company (FUL), Jefferies Financial Group Inc. (JEF), Levi Strauss & co. (LEVI), NovaGold Resources Inc. (NG), Micron Technology Inc. (MU), Trip.com Group Ltd. (TCOM)
- Thursday (6/25): Acuity Inc. (AYI), Blackberry Ltd. (BB), Commercial Metals Inc. (CMC), Darden Restaurants Inc. (DRI), Enerpac Tool Group Corp. (EPAC), FedEx Freight Holding Company (FDXF), Lindsay Corp. (LNN), McCormick & Company (MKC), TD Synnex Corp. (SNX), Winnebago Industries Inc. (WGO)
- Friday (6/26): Apogee Enterprises Inc. (APOG)
Economic Data, Rates & the Fed
There was a moderate dose of economic data for markets to digest this week, which was highlighted by Kevin Warsh's first Federal Open Market Committee (FOMC) meeting and the monthly retail sales report. On the consumer side, retail sales once again came in stronger-than-expected, even when excluding gas station receipts, which suggests resilient spending behavior despite poor consumer sentiment surveys. On the Fed front, stocks tanked and 2-year yields spiked following a hawkish surprise from Warsh and crew. Essentially, the Fed noted that the labor market seems healthy/stable and therefore the focus is on price stability. Here's a breakdown of the reports:
- Federal Open Market Committee (FOMC) Meeting: In Fed Chair Kevin Warsh's first meeting, the FOMC held its benchmark interest rate steady at a range of 3.50-3.75% as expected, but the dot plots showed a lean towards potential hikes this year – 9 officials projected potential hikes, with 6 out of those 9 projecting two or more 25 bp hikes in 2026. Warsh said that price stability was the committee's "North Star", noting that their commitment to a 2% inflation target is "strong, unanimous, and unambiguous".
- Retail Sales: U.S. retail sales rose 0.9% in May, up from +0.4% in April and above the +0.5% analysts were expecting. Excluding sales at gas stations, retail sales rose 0.7%. Control-group sales, which excludes food services, autos, building materials and gas stations and feeds directly into GDP rose a larger-than-expected 0.7%.
- Building Permits: 1.413M vs. 1.450M est.
- Housing Starts: 1.177M vs. 1.450M est.
- Pending Home Sales: 3.8% vs. 0.7% est.
- Empire State Manufacturing: 5.7 vs. 16.0 est.
- Philadelphia Fed Index: 10.3 vs. 5.5 est.
- Leading Economic Indicators: 0.1% vs. 0.0% est.
- EIA Crude Oil Inventories: -8.26M barrels.
- EIA Natural Gas Inventories: +73 bcf.
- Initial Jobless Claims: Initial applications for US jobless benefits decreased 4K from last week's (downwardly revised) 230K to 226K, which was just above the 225K economists had expected. Continuing Claims increased 24K from the prior week to a seasonally adjusted 1.81M.
- The Atlanta Fed's GDPNow "nowcast" for Q2 GDP was first revised from 3.3% down to 2.8% on Tuesday, but then up to 3.0% on Wednesday in response to the stronger-than-expected retail sales report.
The U.S. Treasury yield curve experienced some flattening this week, most of which occurred late yesterday following the hawkish tone out of the FOMC meeting. Earlier this morning, yields on 2-year treasuries hit a 52-week high of 4.217% but subsequently pulled back. Compared to last Friday, 2-year Treasury yields jumped ~7 basis points (4.158% vs. 4.085%), 10-year yields are down ~4 basis points (4.443% vs. 4.487%), while 30-year yields pulled back ~8 basis points (4.898% vs. 4.974%).
Market expectations around Federal Reserve monetary policy shifted sharply in favor of a potential rat hike following this week's hawkish FOMC meeting. Per the Bloomberg rate probabilities, on Tuesday market participants pegged a rate hike at the September FOMC meeting at just 35% and today it stands at 86%. The theoretical 100% probability of a rate hike has moved up to the October FOMC meeting from the January 2027 FOMC meeting last week.
Technical Take
PHLX Semiconductor Index (SOX + 884 to 14,358)
Investors continue to gravitate towards chips stocks as evidenced by the fresh all-time highs in the PHLX Semiconductor Index (SOX) this week. While there might be questions around AI disruption, overspending by hyperscalers or whether ROI will justify AI investment, investors see compute demand still outstripping supply and therefore are riding the AI infrastructure theme until evidence proves otherwise. Yes, bouncing off the 20-day SMA twice and rallying to fresh all-time highs is bullish, but over the past couple weeks volatility has picked up as evidenced by the larger daily candles, and higher frequency of large red bars, on the right side of the chart. Micron reports next Wednesday after the bell, so I suspect volatility (either higher or lower) will pick up in the back of next week, but the near-term technicals remain bullish.
Near-term technical translation: moderately bullish
Source: ThinkorSwim trading platform
Past performance is no guarantee of future results.
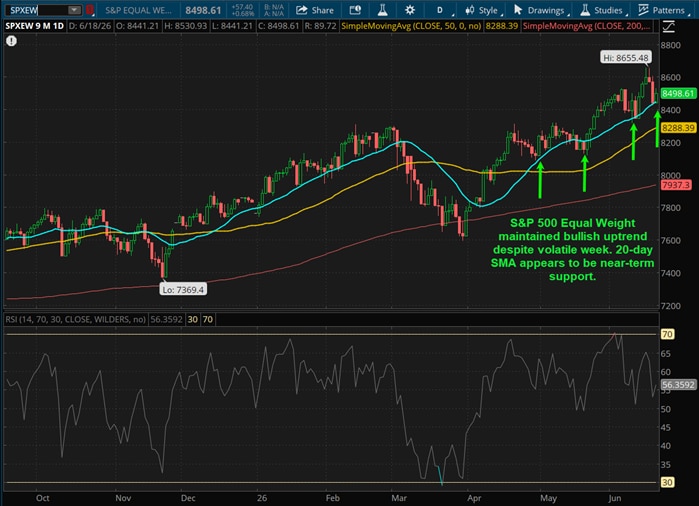
S&P Equal Weight Index (SPXEW + 57 to 8,498)
The S&P Equal Weight index (SPXEW) notched another fresh all-time high this week, supporting the notion that the rally in stocks is seeing broader participation, which is generally a healthy sign in a bull market. The index appears to have found near-term support at the 20-day Simple Moving Average (SMA), followed by (prior resistance) 8,300, which roughly coincides with the 50-day SMA. The uptrend appears to have healthy bid support on pullbacks, and the near-term technical outlook is viewed as bullish.
Near-term technical translation: bullish
Source: ThinkorSwim trading platform
Past performance is no guarantee of future results.
Cryptocurrency News
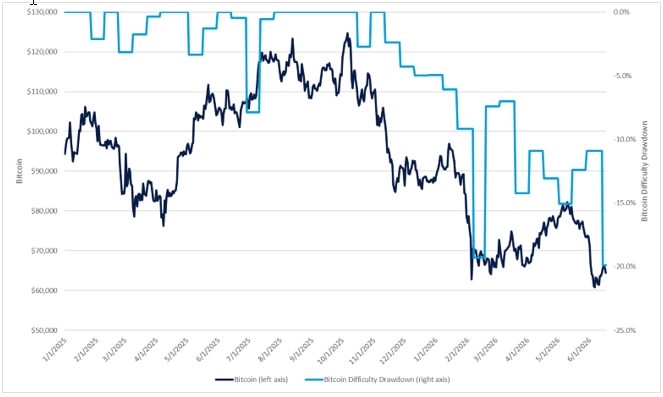
The Bitwise 10 Large Crypto Index is down 1% since last Friday, with bitcoin down 1% and ether up 1% at the time of writing. Bitcoin has once again found support near its 200-week simple moving average, which has historically been a level where bear markets have bottomed, as well as near its cost of production for efficient miners in the low $60,000s.
Preferred stock issuances by Strategy (MSTR) remain in the news flow this week, with STRC falling to $83 at its lows—its steepest discount to par since issuance. While continued negative sentiment in crypto markets may be weighing on STRC, today's sharp move may also reflect leveraged positions in DeFi applications being liquidated. As long as bitcoin remains near these levels, digital asset treasuries and related securities are likely to remain under pressure.
That said, the levels reached in early February continue to serve as support, even though bitcoin briefly made a new intraday low last week. Currently, mining difficulty has fallen 20% from the levels reached last year and is now back near those seen in early February. Bitcoin's next difficulty adjustment is expected to occur on June 27, and current estimates point to a potential upward adjustment. Historically, this has served as confirmation of a bottom following a selloff, as it signals that miners are rejoining the network after temporarily suspending operations.
Source: Glassnode.
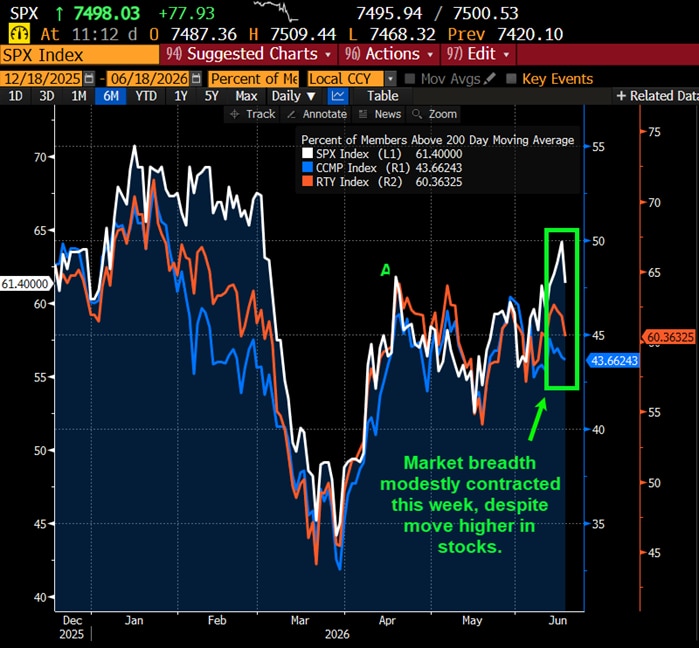
Market Breadth
The Bloomberg chart below shows the current % of members within the S&P 500 (SPX), Nasdaq Composite (CCMP) & Russell 2000 (RTY) that are trading above their respective 200-day Simple Moving Averages (SMA). In short, stocks are on track to be modestly higher this week, but market breadth was flat to down across these major indices. Compared to last Friday, the SPX (white line) breadth is essentially flat at 61.40% versus 61.20%, the CCMP (blue line) eased to 43.66% vs. 44.75%, while the RUT (red line) declined to 60.36% from 61.86% (all week-over-week).
Source: Bloomberg L.P.
Market breadth attempts to capture individual stock participation within an overall index, which can help convey underlying strength or weakness of a move or trend. Typically, broader participation suggests healthy investor sentiment and supportive technicals. There are many data points to help convey market breadth, such as advancing vs. declining issues, % of stocks within an index that are above or below a longer-term moving average or new highs vs. new lows.
This Week's Notable 52-week Highs (110 today): Applied Materials Inc. (AMAT + $40.65 to $633.73), Caterpillar Inc. (CAT + $28.81 to $984.73), Citigroup Inc. (C + $3.47 to $147.25), Freeport McMoRan Inc. (FCX + $0.40 to $69.46), Morgan Stanley (MS + $3.92 to $228.88), Western Digital Corp. (WDC + $69.87 to $782.00)
This Week's Notable 52-week Lows (112 today): Albertsons Companies Inc. (ACI - $0.64 to $13.77), Autodesk Inc. (ADSK + $1.75 to $194.82), Boston Scientific Corp. (BSX - $0.11 to $44.84), Equifax Inc. (EFX + $0.59 to $155.43), Gulfport Energy Corp. (GPOR - $0.16 to $161.46), Leidos Holdings Inc. (LDOS - $1.62 to $107.04)