Looking to the Futures
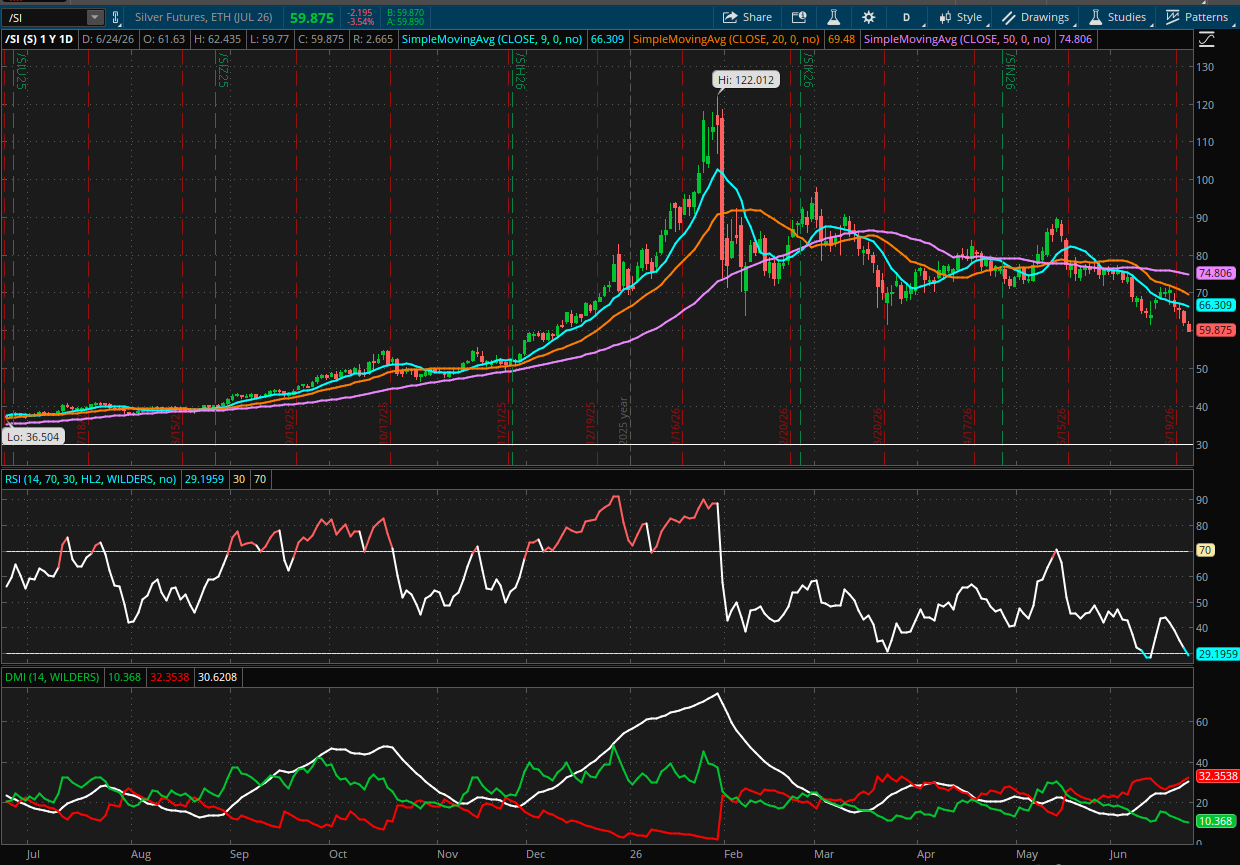
Silver Reaches 2026 Low

For most of the past decade, silver has been largely rangebound. Silver traded between $15 and $30 an ounce from 2013 to 2024. The front-month silver futures contract (/SI) started last year below $30 and ran up as high as $82.67 before ending the year above $70. It then had a supercharged January, gaining over 50 points to reach an all-time high of $121.785 on January 29th. After reaching those highs, the contract sold off sharply at the end of January, dropping 37% over the next two trading days.
After the dramatic price action, the contract established a new normal between $65 and $90. It has been trending lower over the past six weeks as Fed policy expectations and dollar strength have weighed on precious metals. The contract settled below $63 for the first time since December yesterday, alongside the dollar index ($DXY) breaking above 101 for the first time since last May. Both are occurring amid expectations for higher rates. The CME FedWatch tool now shows a 70% chance of a rate hike at the September meeting. Longer-term treasury rates are also up, increasing the opportunity cost of holding silver. The 10-year treasury yield (TNX:CGI) has risen from 4.16% to 4.48% and the 30-year treasury yield (TYX:CGI) is slightly higher at 4.93, up from 4.84%.
While silver has seen a sharp decline from the January highs, there is a persistent supply deficit. According to the Silver Institute, demand will exceed supply in 2026 by approximately 46 million ounces. That represents an increase of 6 million ounces from the 2025 deficit and marks the sixth straight year of supply deficits. Silver in storage is down by over 750 million ounces since 2021. The widening supply deficit is expected despite concurrent expectations for a 2% decrease in demand this year.
That combination of deficits and dwindling supply has provided support to prices. Mine supply growth is limited due to the long runway on investment following years of low prices. Industrial demand from sectors like solar panels and electric vehicles shows little sign of waning. On the other hand, higher yields and continued strength in the dollar could put a lid on prices.
Technicals
The remarkable run in silver is obvious in the chart. The more impactful trends for future price action have occurred since the peak. The 9-, 20- and 50-day SMAs have seen a few crossovers since the rally came to a sudden stop in late January. The RSI has ranged between overbought and oversold for brief periods. It is currently in oversold territory after three red days in a row. The Directional Moving Index shows a bearish trend of increasing strength.
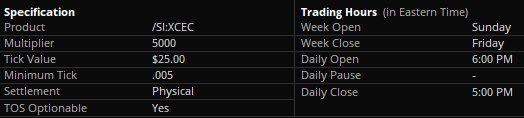
Contract Specifications
Major economic reports, trading events, and news items that could potentially impact specific futures markets:
Economic Calendar
Current Account Balance 8:30 AM ET
EIA Crude Oil Inventories 10:30 AM ET
MBA Mortgage Applications Index 7:00 AM ET
New Home Sales 10:00 AM ET
New Products
New futures products are available to trade with a futures-approved account on all thinkorswim platforms:
- Ripple (/XRP)
- Micro Ripple (/MXP)
- 100 OZ Silver (/SIC)
- 1 OZ Gold (/1OZ)
- Solana (/SOL)
- Micro Solana (/MSL)
Visit the Schwab.com Futures Markets page to explore the wide variety of futures contracts available for trading through Charles Schwab Futures and Forex LLC.